Axiom Soft
AX Qubic Business Intelligence And Reporting
Get your free copy of AX Qubic BI. Its free to try.
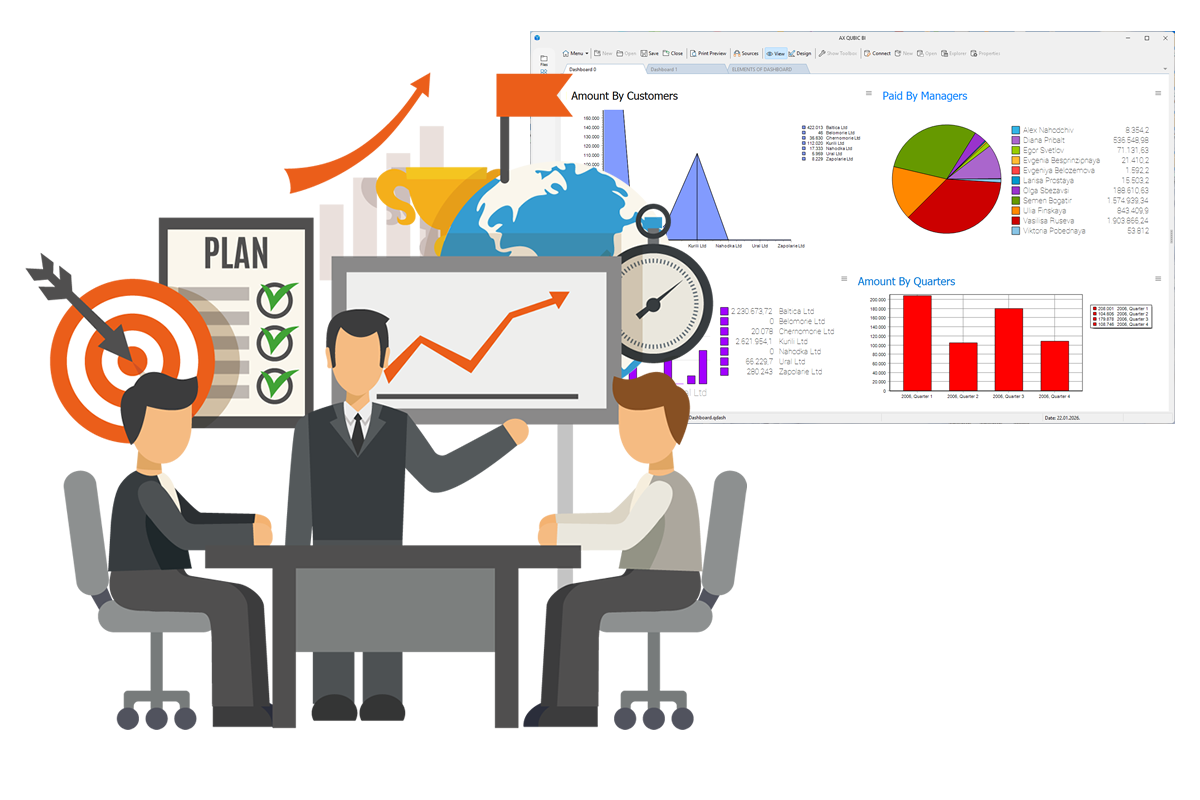
Meet the AX Qubic BI
AX Qubic BI. Business Intelligence That Works for You.
Get your free copy of AX Qubic BI. Its free to try.
For Developers
If you are a developer (especially a Delphi developer) you can integrate AX Qubic BI with your existing ERP software. AX Qubic BI can be seamlessly used as an add-on to your ERP system, extending its capabilities with powerful business intelligence and reporting features. This integration enriches your ERP software with deeper insights, advanced analytics, and more flexible reporting.
AX Qubic BI
AX Qubic BI is a scalable business intelligence and reporting solution built to support data-driven organizations. It connects data from multiple sources, transforms it into structured insights, and presents it through interactive dashboards and customizable reports.
Whether you need operational reporting, management dashboards or advanced analytics, AX Qubic BI provides the clarity and control needed to make better business decisions—faster and with confidence.
AX Qubic BI operates in two modes, depending on the purchased license: Designer and Viewer.
The Designer mode allows users to create and design solutions, dashboards and other objects.
The Viewer mode is intended for viewing purposes only. It allows users to open and view objects but does not permit any modifications or saving of changes.
AX Qubic BI is built on technology from the software company FastReport®. It uses FastCube for OLAP cubes and FastReport for report designers. The charts use TeeChart components developed by software company Steema.
Solutions, Dashboards, and OLAP Cubes store all their data in file-based format. For OLAP Cubes and Dashboards, a connection to the data source is not required during analysis; it is needed only for the initial data retrieval. Once the data is prepared, it can be further analyzed in offline mode.
Supported Database Servers
AX Qubic BI can connect to the following database servers:
| Database | Version |
|---|---|
| SAP Advantage Database | v 8.0 – 12.0 |
| SAP SQL Anywhere | v 5.0 – 16.0 |
| IBM DB2 Server | v 8.2 – 9.7 |
| Firebird | v 1.5 – 5.0 |
| InterBase | v 6.0 – 2020 |
| IBM Informix | v 8.0 – 12.1 |
| MongoDB | v 3.0 – 8.0 |
| Microsoft Access | 95 – 2015 |
| Microsoft SQL Server | 2000 – 2022 |
| MySQL Server | v 3.21 – 9.0 |
| MariaDB | v 5.5 – 10.6 |
| Oracle Server | v 8.0 – 19.13 |
| PostgreSQL | v 7.4 – 16.0 |
| PostgreSQL Enterprise Server | v 9.2 |
| SQLite | v 3.0 – 3.42 |
| Teradata | v 13.0 – 15.0 |
| Generic ODBC sources | v 2.0 – 3.8 |
Modules
AX Qubic BI contains the following modules:
- Workspace (Solutions and Projects)
- Dashboards
- Cubes
- Queries
- FastReport Viewer
- FastReport Designer
- Server version with MS SQL database
Workspace
The Workspace is the main application module where most of the core functionality is performed. It serves as the working area for the following objects:
- Solutions and Projects
- OLAP Cubes
- Report Designer
- Prepared Reports Viewer
- SQL Query Editor
Solutions and Projects act as containers that provide a visual environment for organizing and integrating projects and objects. Solutions enable a clear visual separation of objects into projects, improving structure and workflow efficiency. All of the objects listed above can be integrated into projects within a solution.
Only one solution can be open in the application at any given time. Within a solution, users can add or remove projects and other objects as needed.
Each object can have its own database connection. However, projects allow a shared data connection to be defined at the project level, which is then used as the data source for all objects within that project.
This does not apply to Report Designers, which always maintain their own independent connections to data sources.
The Workspace displays objects using a tab-based interface, allowing multiple objects to be opened simultaneously. This approach simplifies navigation and improves productivity, as users can quickly switch between objects by changing tabs.
Objects are independent entities that can be included in solutions and projects. The Workspace also allows objects to be added outside of solutions and projects. This means that objects or files can be opened independently and will appear as standalone (free) objects, not associated with any specific solution or project.
Solutions, projects, and objects are files that can be easily transferred or copied to other locations. Solutions contain the following objects: OLAP Cubes, Queries, Reports and Prepared Reports.


Dashboards
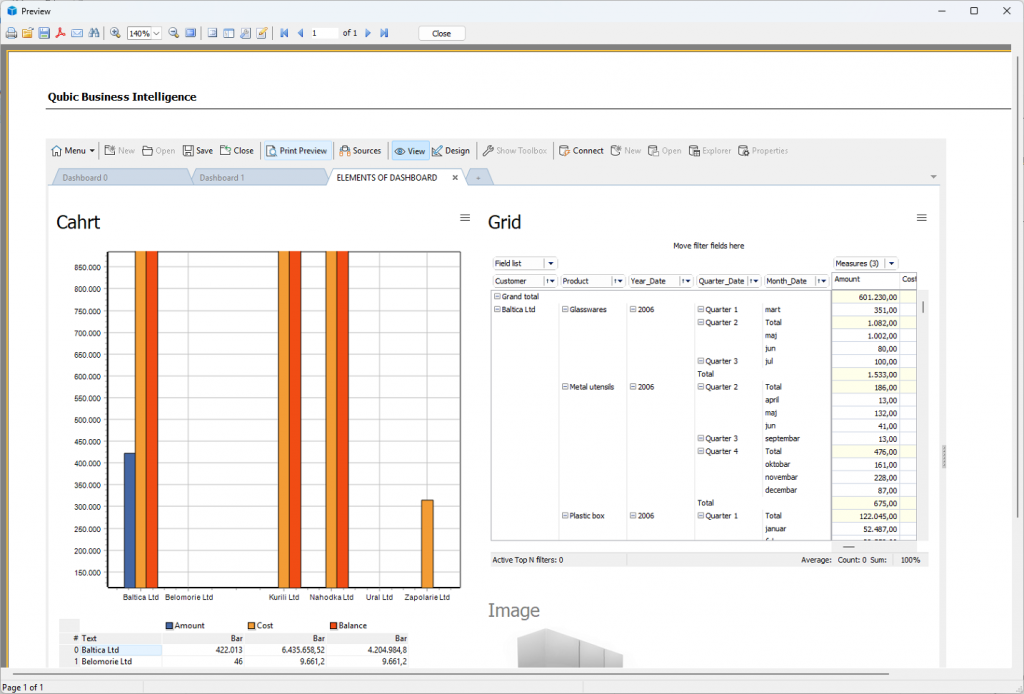
Dashboard is used for visual interpretation of data presented through tables and charts. Our dashboard can display objects through tabs so you can have multiple pages of objects.
A dashboard is a file that contains all objects, connections and data. The advantage of our dashboard is that all data is offline. This means that data can be generated directly when there is a connection to the data server and the generated data can be viewed offline.
The Dashboard Viewer and Designer is a unified interface for creating and viewing dashboards. It allows seamless switching between View Mode and Design Mode.
In Design Mode, users can create dashboard pages and add objects such as grids, charts, combined grid–chart components, and standard elements including labels, memos, and images. Each object can be connected to a data source and fully customized through its properties. The charts use TeeChart components developed by software company Steema, a solution well known within the Delphi developer community.
Before adding any objects, a Dashboard Source Controller must be defined. The source controller manages connections to OLAP Cube data sources. Each connection may contain multiple OLAP cubes.
An OLAP Cube serves as a structured data storage layer based on SQL queries and database connections. Data can be loaded online directly from the database or stored offline for later use.
Once completed, the dashboard is generated as a single file containing all configuration and data. This file can be easily shared and opened using the Dashboard Viewer, enabling quick distribution and consistent viewing across environments.




OLAP Cubes
An OLAP Cube is an object based on FastReport technology, specifically the FastCube component.
FASTCUBE® is a tool for effective data analysis.
FastCube enables you to analyze data and to build summary tables (data cutoffs) as well as to create various reports and graphs easily and instantly. It’s a handy tool for efficient analytical data arrays handling.
A traditional FastCube is a static cube that contains predefined data and layouts (schemas). Our OLAP Cube, however, is dynamic. It includes a connection to a data source, an SQL query with parameters used to generate the data, the generated data itself, table layouts, and charts associated with the data.
All of these elements are stored within a single file. This file can be transferred to other locations and viewed offline. A cube can contain one or more table layouts, and new layouts can be created as needed. Charts can also be added to provide visual representations of the data.
Core Features
- FastCube is a set of OLAP desktop components for Delphi / C++ Builder / Lazarus.
- Database connectivity is supported not only through standard FireDAC (FD), ADO or BDE components, but also via any component based on TDataSet.
- Immediate data retrieval and handling of data arrays.
- Ability to restrict users from modifying the schema.
- All basic statistical operations (count, sum, minimum, maximum, average, variance, etc.).
- Special functions (distinct count, first value, list of distinct values).
- Filters for measured values.
- Calculated data (based on FastScript).
- Calculated value filters during data calculation (based on FastScript).
- FastCube data can be stored in a compact format for data exchange and storage.
- Instant creation of data slices based on data source schemas or SQL queries.
- Unlimited number of measures in summary tables.
- Ability to minimize entire measures as well as individual values.
- Control over the display of total values.
- Axis sorting control (by measure values or data).
- Control of sorting at each measure level (sorting lines).
- Saving templates (schemas) and data for future use.
- Support for date, time, and row-type data.
- Automatic layout for date and time components.
- Calculated filters for numeric data using output formatting.
- Ability to place data in table columns or rows, as well as at any measure level.
- Control of numeric data display using output formatting.
- Numeric output as a value or percentage (per row, column, group, or total table).
- Conditional highlighting of cell values in ranges.
- Export of FastCube slices to Excel, Word, or HTML.
- Copying selected ranges to the clipboard.
- Viewing and exporting cell-level details of data slices.
- Delivery of cube/slice data in the following formats: XML for Analysis, XML-MSData, MS Rowset, or DataPacket.
- Printing via FastReport.
- Chart creation using TeeChart.
- End users do not require advanced programming skills to create reports.
Queries
Queries are objects that contain SQL statements. Data connection information and SQL text are stored in a file.
Unfortunately, visual interpretation of SQL text is not currently supported. Support for a visual designer will be introduced in future versions.
FastReport Designer
The Report Designer uses the powerful Delphi component from the well-known company FastReport® called the VCL FastReport Designer. The FastReport Designer is highly popular among companies and developers using the Delphi IDE, and is widely regarded as the best tool for designing reports in Delphi.
The Report Designer is a modern solution for integrating Business Intelligence into your software. It is designed for developers who want to leverage ready-made reporting components. FastReport combines ease of use, practicality, and a small distribution size with high functionality and performance on nearly any modern computer.
Key Features:
- Reports are application-independent, meaning that when a report is modified, the application does not need to be recompiled.
- Clean and simple classic interface – business users can start working with the designer immediately.
- Interactive object editors.
- Code-based reports.
- Enhanced guidelines for more precise report editing.
- Separate tabs for Design, Data, and Code – a complete report development environment!
- Flexible designer architecture allows the creation of custom editors for both existing and new objects.
- OLAP report generation.
- Support for multiple types of barcode components.
- Built-in script editor supporting four languages: PascalScript, C++Script, BasicScript, and JScript.
- Advanced debugging tools for scripts.


FastReport Viewer
Prepared reports are reports created in the FastReport Designer that include ready-to-use data, meaning they can operate offline. These prebuilt reports, stored in .frp files, contain both the data structure and the actual data. This object serves as a file viewer for these reports.
The application has a very simple design, as it functions solely as a viewer for prepared reports.
The application can read the following file types:
- Prepared report files (.fp3)
- Designed report files (.fr3)
The application can also open original designed report files (.fr3); however, in this case, an active connection to the data source is required.
Server version
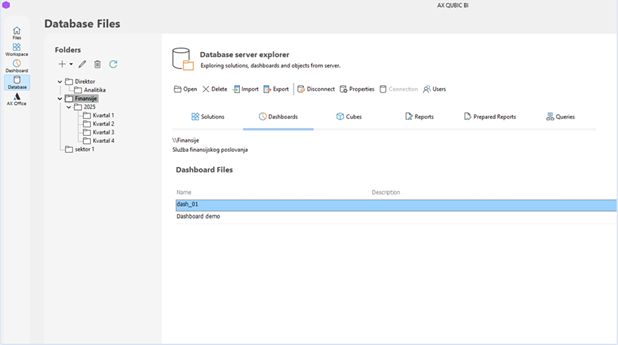
The standard operating mode of AX Qubic BI is file-based, where users work with object files stored locally. In addition to this mode, the application supports a File Server configuration, allowing all files to be stored centrally on a server backed by a database.
Microsoft SQL Server is used as the storage database and can also be deployed using its free edition.
Access to server-stored data requires user accounts to be defined, ensuring controlled and secure data access.
Data is logically organized into folders that contain all application objects. These folders are not physical directories on a remote file system; instead, they represent a logical structure managed within the database.
By storing files in the database, AX Qubic BI enables centralized file management, allowing users to easily share, access, and maintain all objects from a single, unified location.