
Axiom Soft
AX DevX Business Intelligence And Reporting
Get your free copy of AX DevX Report Viewer. Its free to try.
Meet the AX DevX BI
AX DevX Business Intelligence. Transforming Data into Intelligence.
Get your free copy of AX DevX Report Viewer. Its free to try.
For Developers
If you are a developer (especially a Delphi developer) you can integrate AX DevX BI with your existing ERP software. AX DevX BI can be seamlessly used as an add-on to your ERP system, extending its capabilities with powerful business intelligence and reporting features. This integration enriches your ERP software with deeper insights, advanced analytics, and more flexible reporting.
AX DevX BI
AX DevX BI is a suite of applications for business intelligence and reporting. The application serves as a tool for creating business analytics and intelligence through dashboards, reports and pre-built reports.
The AX DevX BI suite consists of four independent applications:
- AX DevX Dashboard Designer
- AX DevX Dashboard Viewer
- AX DevX Report Designer
- AX DevX Report Viewer
The applications are built using components from the software company DevExpress®. The application uses Dashboard and Report Designer components from DevExpress, which are highly regarded and well-known in the software industry.
You can view DevExpress end-user documentation for the dashboard and reports at the following links:
Supported Database Servers
AX DevX BI can connect to the following database servers:
| Data Source | Supported Versions |
|---|---|
| Microsoft SQL Server | 2005, 2008, 2008R2, 2012, 2014, 2016, Express Edition, Azure SQL Database |
| Microsoft Access | 2000 or later |
| Microsoft SQL Server CE | 3.5, 4.0 |
| Oracle Database | 9i or later |
| Amazon Redshift | n/a |
| Google BigQuery | n/a |
| Teradata | 13.0 or later |
| SAP Sybase Advantage | Advantage Database Server 9.1 or later |
| SAP Sybase ASE | Sybase Adaptive Server 12.0 or later |
| SAP SQL Anywhere | 11 or later |
| IBM DB2 | 9.5 or later |
| Firebird | 1.5 or later, Dialect 3 |
| MySQL | 4.1 or later |
| Pervasive PSQL | 9.x or later |
| PostgreSQL | 7.x or later |
| VistaDB | 4, 5 |
| SQLite | 3.x |
| XML file | n/a |
Dashboard Designer
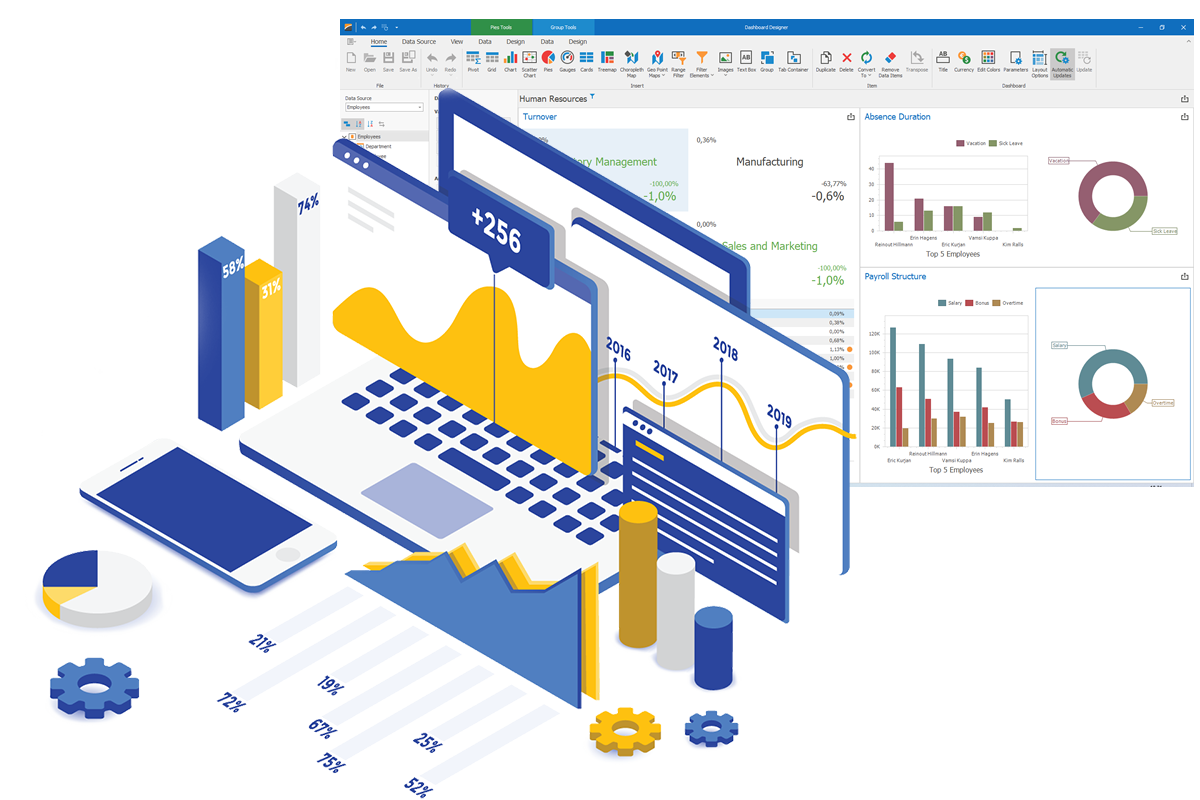
The AX DevX Dashboard Designer enables the creation of fully interactive Business Intelligence dashboards without writing a single line of code. Simple and intuitive runtime customization allows organizations to reduce development time and associated costs by empowering users to personalize dashboards according to their specific requirements.
The AX DevX Dashboard eliminates complex and time-consuming dashboard design tasks by introducing a fully optimized drag-and-drop user environment, enabling the delivery of professional business dashboards in record time.
The AX DevX Dashboard solution includes a fully integrated set of powerful, high-performance data analysis features, allowing intuitive and easy-to-read Business Intelligence dashboards to be delivered in the shortest possible time.
The Dashboard Designer must always maintain an active connection to the data source in order to display data. If the connection is not active, data cannot be displayed, which means the designer does not support offline operation.


Dashboard Items
AX DevExpress Dashboard allows the addition of a wide range of objects (dashboard items) used for data visualization and interaction. Below is an overview of the most important available item types:
- Charts: Line, bar, and scatter charts for trend analysis and comparisons.
- Grid: Tabular data presentation with sorting and filtering capabilities.
- Pivot: Multidimensional data displayed in pivot table format.
- Pie / Donut: Proportional values displayed as pie or donut charts.
- Cards: KPI cards displaying key metrics with performance indicators.
- Gauges: Visual indicators showing progress toward defined goals (KPIs).
- Scatter Chart: Visualization of relationships between numerical variables.
- Choropleth Map: Geographic regions colored according to data values.
- Geo Point Map: Display of points on a map with markers.
- Bubble Map: Bubble-based visualization proportional to data values.
- Pie Map: Pie charts positioned on geographic locations.
- Range Filter: Interactive filtering for time or numeric ranges.
- List Box / Combo Box: Value selection for data filtering.
- Tree View: Hierarchical filtering by categories.
- Tab Page: Grouping dashboard elements into tabs.
- Group: Combining multiple elements into a single section.
Key Advantages
AX DevDX Dashboard offers several key advantages over competing solutions, particularly in terms of integration, flexibility, and performance. Below is a summary of the most important benefits:
- Seamlessly integrates with applications developed using WinForms, WPF, ASP.NET, Blazor and other .NET technologies.
- Built-in Dashboard Designer allows users to create and customize dashboards without programming.
- Drag-and-drop interface simplifies usage and accelerates development.
- Supports a wide range of objects: charts, tables, KPI cards, maps, filters, and more.
- All components are highly customizable and optimized for performance.
- Support for master-detail views, drill-down analysis, dynamic filtering, and parameters.
- Users can explore data interactively without additional coding.
- Dashboards can be exported to PDF, Excel, images, and other formats without loss of quality.
Dashboard Viewer
The application serves as a dashboard viewer for dashboards created with AX DevX Dashboard Designer. Its design is intentionally simple and minimalist, focusing solely on its primary purpose: delivering a seamless and intuitive dashboard viewing experience.
AX DevX Report Designer
The success of a modern business enterprise depends on the accurate exchange of critical information across the organization. Demonstrating the impact of individual decisions to both managers and employees requires an intuitive, cross-platform reporting solution that delivers exceptional performance and extensive customization capabilities.


AX DevX BI come with a fully integrated Report Designer, report wizards, pre-built report templates and end-user report designers. The main advantages of the designer include:
- Drag-and-drop interface for placing report controls such as labels, text boxes, images, tables, and charts.
- Tools to connect reports to various data sources, including databases, Excel files, JSON, and custom objects, as well as to create queries and relationships between data tables.
- Support for adding interactivity to reports, including drill-down functionality and interactive sorting.
- Ability to use expressions and scripts to add dynamic logic and calculations to reports.
- Built-in functionality for report preview, printing, and exporting to multiple formats, such as PDF, XLSX, DOCX, and more.
- A comprehensive API enabling developers to fine-tune the designer’s user interface, integrate custom report controls, and define the data sources available to end-users.
- Designer Tab
- The primary workspace for designing reports
- Uses bands (Detail, Header, Footer, etc.) to organize content
- Drag-and-drop interface for adding controls, such as:
- Label, Table, Chart, Barcode, PictureBox, RichText, Subreport, etc.
- Preview Tab
- Displays the generated report in real time
- Allows:
- Printing, exporting to PDF, Excel, Word, images
- Navigation, page setup, zooming
- Display of parameters and watermarks
- Scripts Tab
- Writing custom C# or VB.NET code for advanced logic
- Used for dynamic calculations, conditional formatting, and control behaviors
AX DevX Report Viewer
The application is a report viewer for reports generated using the AX DevX Report Designer. It allows users to preview and print report documents using the DevExpress Report Viewer, and to export data to various custom file formats, including PDF, DOCX, RTF, XLS, XLSX, TXT, MHT, CSV, HTML, and multiple image formats.


